My Actual Solar & Battery Numbers

I run this site, so it is only fair I share my own numbers. No modelling, no estimates, no "typical household". Just my actual electricity bills since I moved into this place in March 2023. I installed solar around October 2023, and added a battery in February 2026.
Here's the full record, quarter by quarter.
Key Findings
| Evidence | Published result | Important limit |
|---|---|---|
| Solar purchase | $4,000 installed after STCs | October 2023 price for this home |
| Battery and inverter | $6,949 invoice total | Unusually large system bought during a favourable rebate period |
| Matched Q2 bills | Grid imports fell 70% and the bill fell 51% after the battery | Tariffs, weather and usage also changed |
| Model check | Solar estimate was 5.7% above the bills. Battery estimate was 22% above the early bill result | One home and only one complete quarter after the battery |
| Quarter | Days | Avg Daily Usage (kWh) | Total Grid Usage (kWh) | Solar Export (kWh) | Bill (incl. GST) |
|---|---|---|---|---|---|
| Q1 2023* | 22 | 15.7 | 346 | 0 | $165.44 |
| Q2 2023 | 94 | 24 | 2,256 | 0 | $749.47 |
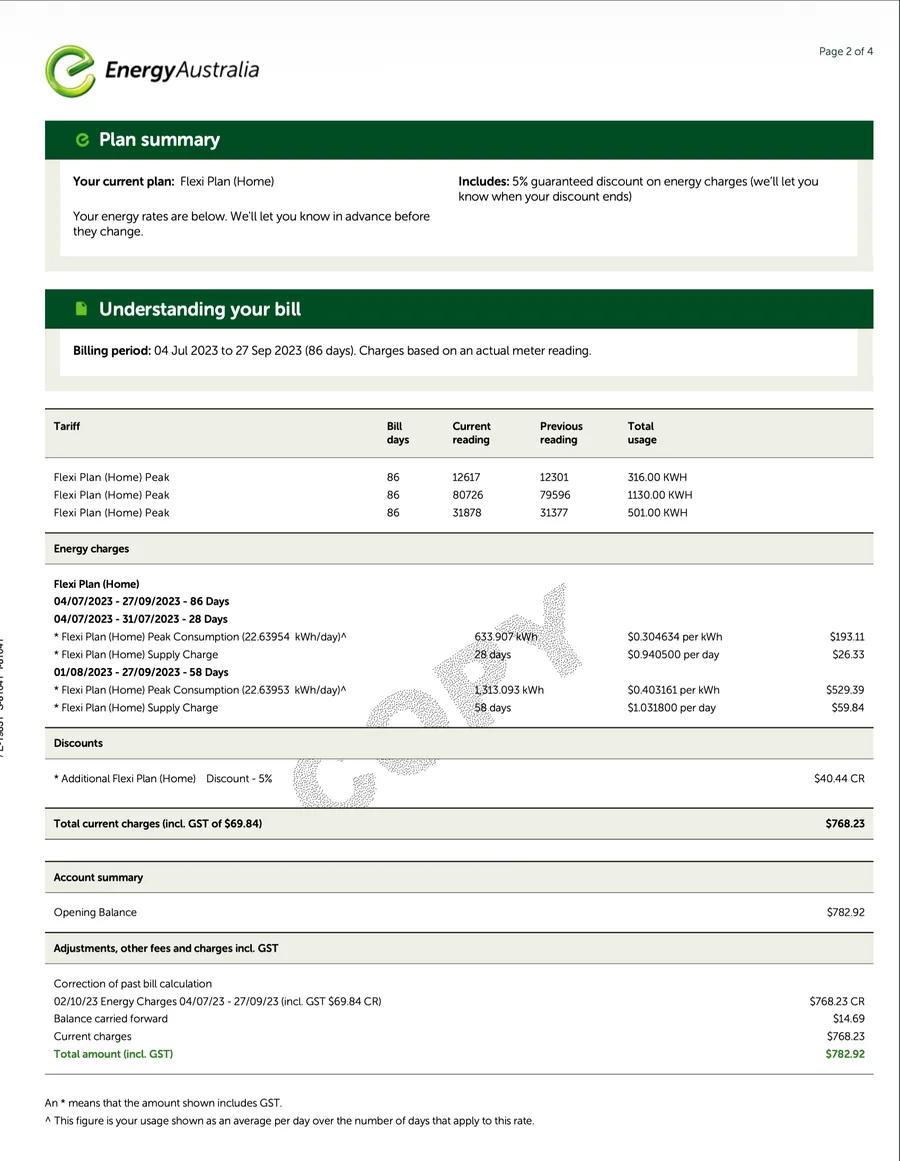
| Q3 2023 | 86 | 22.6 | 1,947 | 0 | $782.92 |
| Q4 2023 (solar) | 91 | 14.3 | 1,300 | 1,395 | $488.30 |
| Q1 2024 | 91 | 12.4 | 1,129 | 2,224 | $349.95 |
| Q2 2024 | 91 | 15.3 | 1,389 | 1,733 | $430.17 |
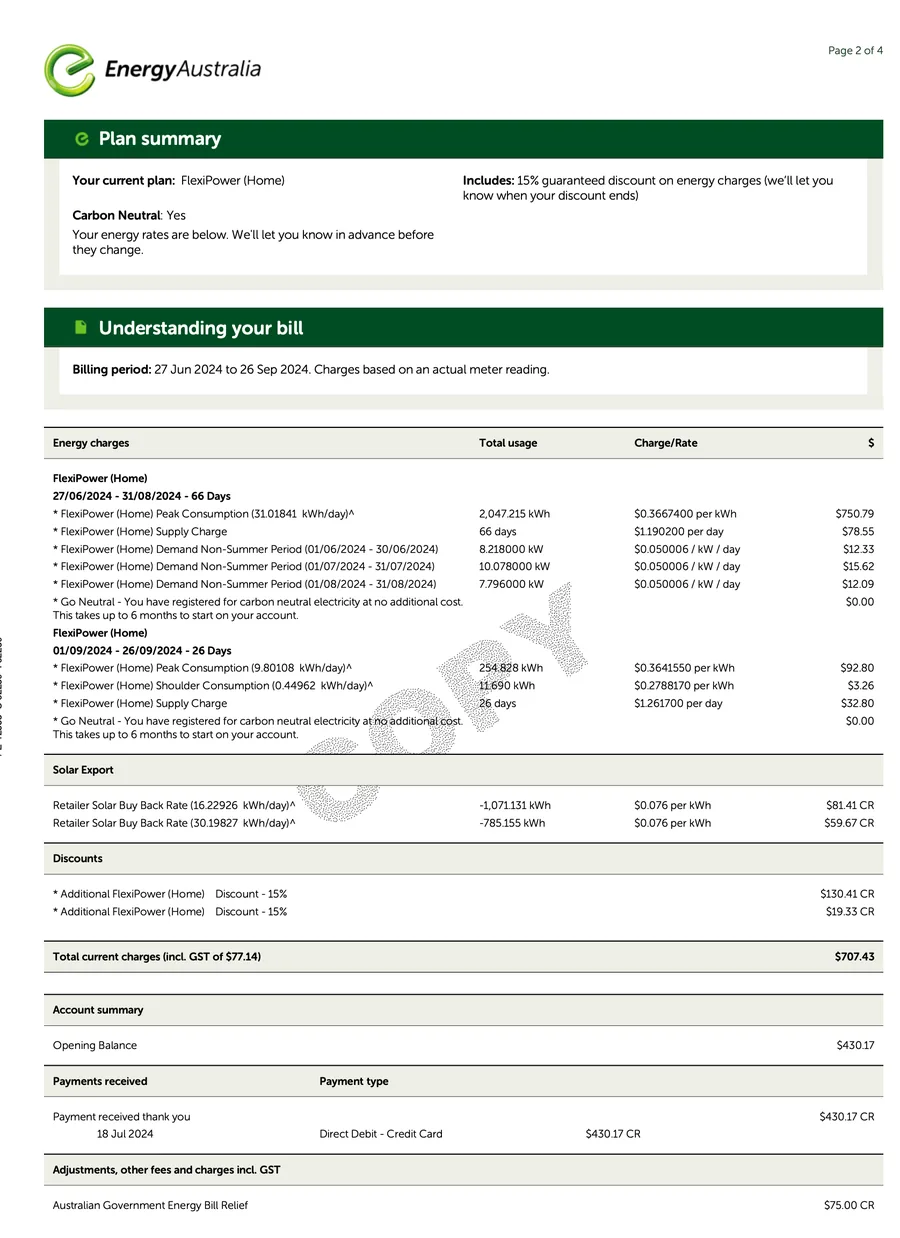
| Q3 2024 | 92 | 25.2 | 2,314 | 1,856 | $557.43 |
| Q4 2024 | 92 | 12.4 | 1,138 | 2,537 | $365.16 |
| Q1 2025 | 94 | 12.8 | 1,203 | 2,199 | $387.74 |
| Q2 2025 | 91 | 24.7 | 2,248 | 1,505 | $505.80 |
| Q3 2025 | 92 | 27.4 | 2,522 | 1,747 | $594.92 |
| Q4 2025 | 92 | 19.2 | 1,764 | 2,451 | $400.32 |
| Q1 2026 (battery) | 90 | 8.6 | 776 | 1,162 | $248.71 |
| Q2 2026 (battery) | 91 | 7.4 | 673 | 306 | $246.88 |
(solar) = panels installed (Oct 2023) | (battery) = battery installed (Feb 2026) | * = partial quarter (moved in mid-March 2023)
See all 25 bills in full — every bill since March 2023, arranged by date.
The Setup
I am in a 5-bedroom house in NSW, Australia. Three adults, two kids, and most of us work from home so there is nearly always someone here running computers, heating or cooling, and appliances. We have gas for cooking and hot water. The solar system is 7.92kW of panels, and as of February 2026, a 12kW hybrid inverter with a 53.76kWh battery.
I switched retailers a few times chasing better rates. EnergyAustralia at first, then Ampol Energy, now AGL. The rates and feed-in tariffs shifted around, but the pattern in the table is what matters.
What I Paid
Every guide about solar talks about payback. Here is the part most people leave out: the actual cost.
I paid $4,000 for the 7.92kW solar system, installed, after the federal STC rebate. That was October 2023. The February 2026 invoice for the 12kW hybrid inverter and 53.76kWh battery totals $6,949. I round that to $7,000 throughout this article, making the combined outlay approximately $11,000.
The battery price needs context. The Australian Government's Cheaper Home Batteries Program launched on 1 July 2025. For batteries installed from January through April 2026, the official factor was 8.4 Small-scale Technology Certificates per kWh of usable capacity, with certificates limited to the first 50 kWh. That made this system eligible for up to 420 STCs. The dollar value depended on the STC sale price and retailer fees; it was not a guaranteed dollar amount per kWh. The difference between the roughly $22,500 pre-discount price and the $6,949 invoice is about $15,551, equivalent to about $37 per STC. That is an inference because the invoice does not itemise the certificates. From 1 May 2026, the factor fell to 6.8 and support began tapering above 14 kWh, with the steepest reduction above 28 kWh. See the Clean Energy Regulator's battery rules. Timing mattered. The invoice proves the final invoiced price and equipment description; it does not prove final payment completion.
This is an atypical installation. Clean Energy Regulator data says household installations in 2025 were dominated by the 15–20kWh capacity band. At 53.76kWh, this system is far outside that centre of the residential market. My household also uses more electricity than many homes, and I bought during an unusually favourable rebate window. The $6,949 invoice should not be used as a normal market benchmark for either this capacity or a typical household battery. See the regulator's 2025 installation-size data.
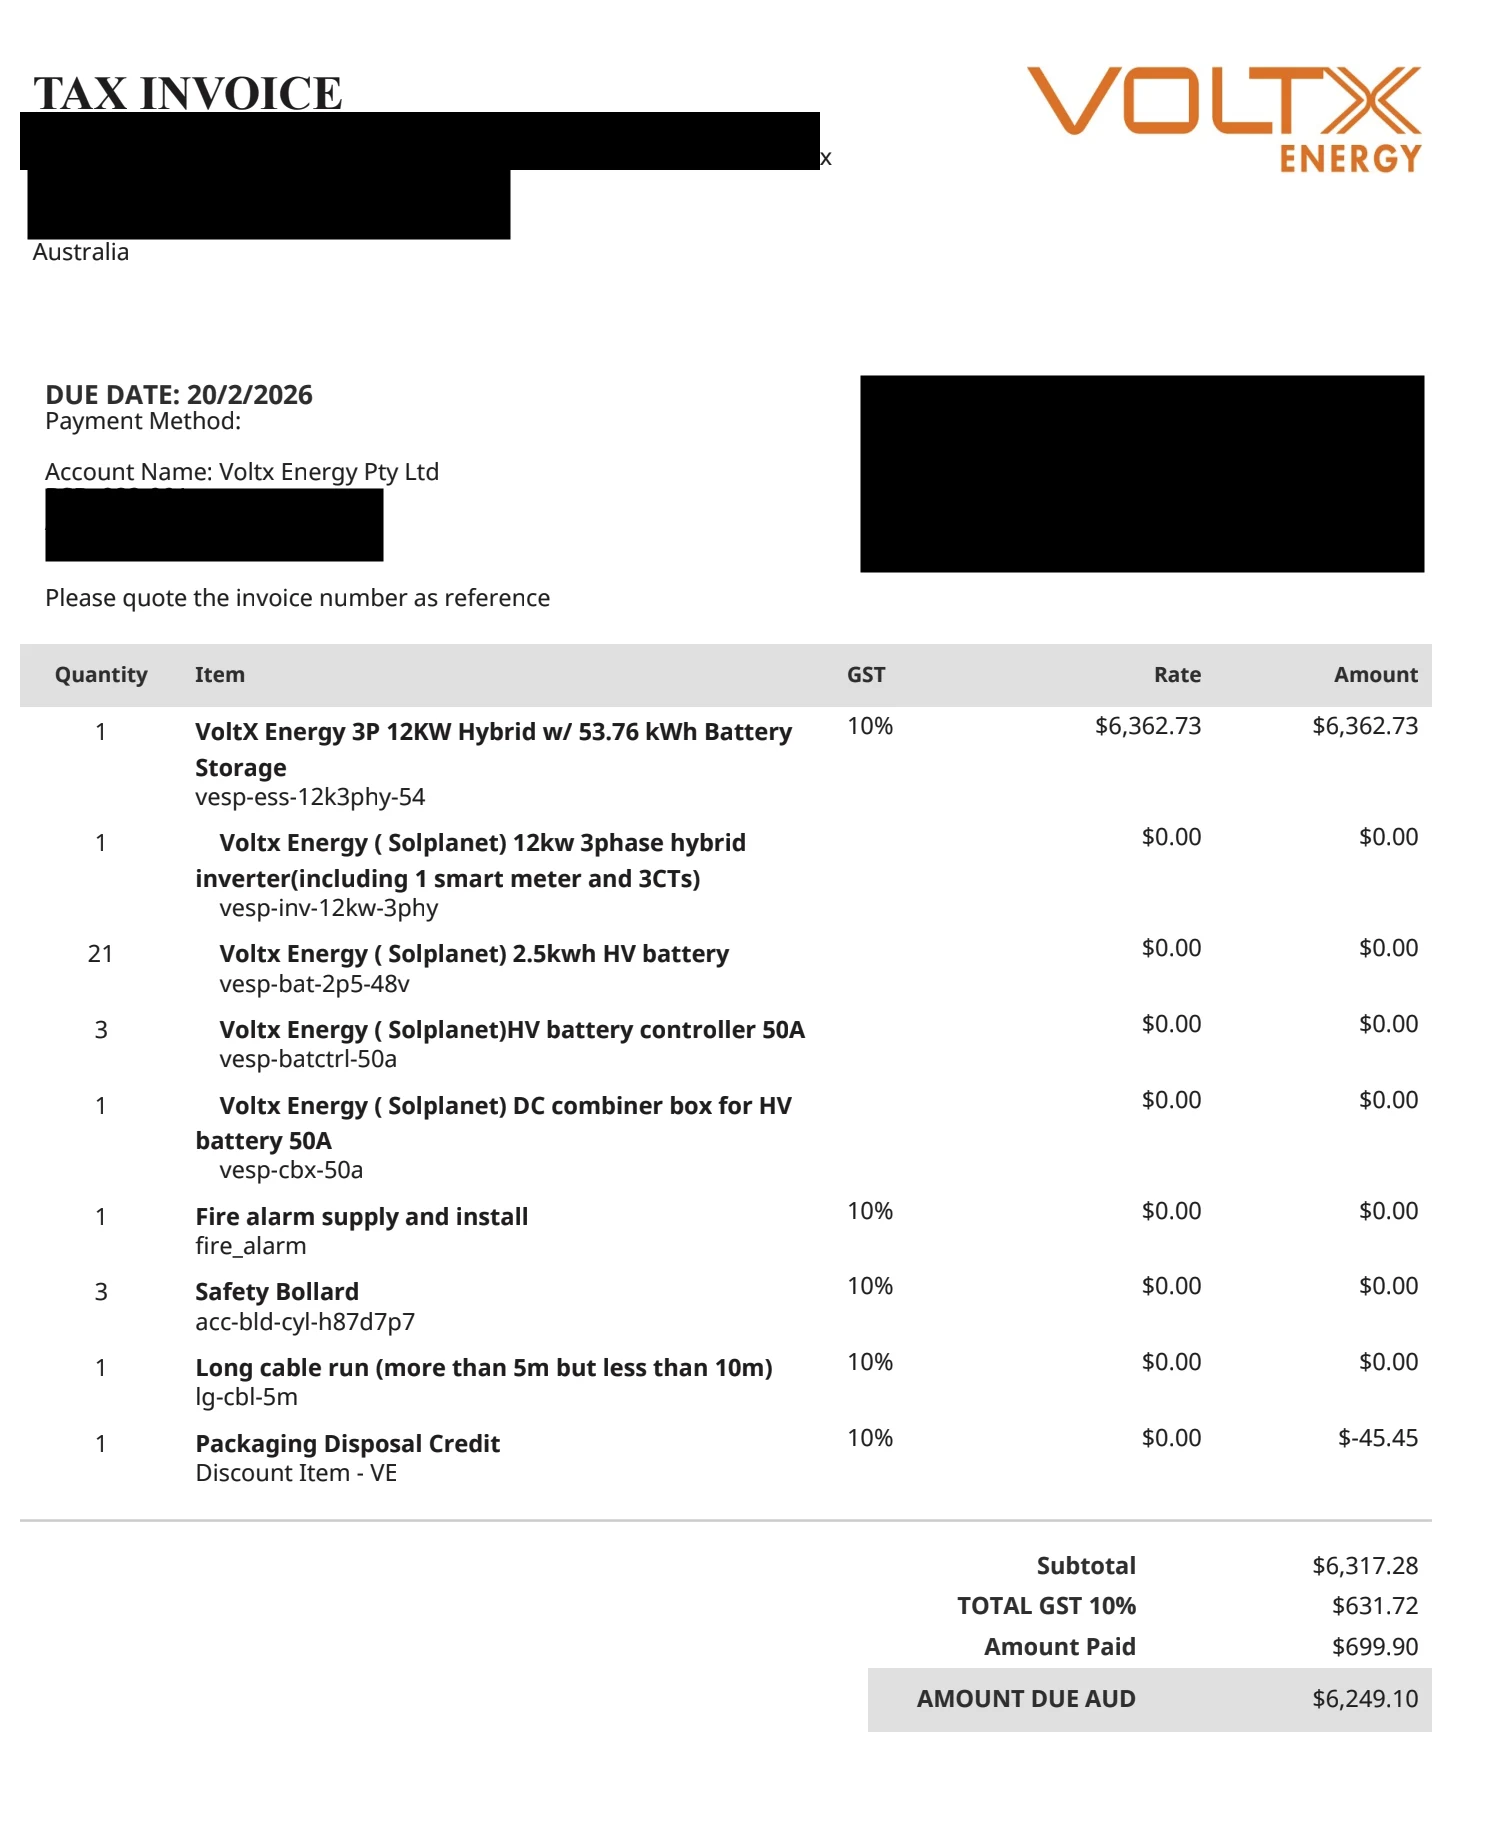
Customer, address, invoice reference, and payment details are permanently redacted. The published WebP contains no embedded metadata.
To keep bill evidence separate from calculator estimates, I annualised each phase on the same 365-day basis. The first two complete pre-solar quarters imply about $3,107 per year. The complete 2024 and 2025 solar-only years average about $1,783 per year. Q2 2026, the first complete post-battery quarter, annualises to about $990 per year. On those observed run rates, solar reduced annual cost by about $1,324, and the battery has provisionally reduced it by a further $793. The battery figure is based on one quarter, not a full year, so seasonal and tariff effects could move it materially.
I ran my pre-solar numbers through the same calculator on this site. But I did not model solar and battery as one big system. I split it into two steps, because that is what actually happened. I bought panels first. I added the battery two years later.
First, the panels. My pre-solar usage was 23.3 kWh a day at roughly $0.30/kWh. The calculator estimates that a 7.92kW system at $4,000 saves about$1,400 in year one, for a modelled payback of about2.9 years. The observed annualised reduction is about $1,324, which is similar in scale but not the same number. At that observed rate, simple payback is closer to three years, before maintenance or financing costs.
Then, the battery. By the time I was ready for a battery, I already had solar. I was importing about 15 kWh a day from the grid and exporting about 20 kWh a day at 7c. That is the real starting point. Adding a 53.76kWh battery captures about 12 kWh a day of that exported solar and shifts it into the evening. Grid imports drop to roughly 3 kWh a day. The model estimates net savings after lost export credits of about $970 in year one. At the rounded $7,000 installed cost, that is a modelled simple payback of about 7.2 years. The provisional observed run-rate reduction is lower at about $793, which would imply roughly 8.8 years if it held for a full year. There is not enough post-install data yet to choose between them.
If you model solar and battery together from scratch, the calculator spits out a tidy 5-year combined payback. That number is not wrong. It is just not what happened. I did not buy both at once. I bought solar first, lived with it for two years, and then added a battery. The battery math starts from an already-improved baseline, so its payback is naturally longer. Two separate decisions, two separate payback clocks.
Across the 33 months since the panels were installed, I have paid $4,575 to my retailers. At my pre-solar burn rate of $8.51 per day, the same period would have cost roughly $8,570. That means I have saved about $4,000 so far. Most of that came from the panels — they have been running the whole time, including during the battery months. The battery has contributed a smaller incremental slice on top, which is directionally consistent with the model. Five months of battery-era bills are not enough to validate a seven-to-nine-year payback forecast.
Three Phases, One Table
The table splits into three clear chapters.
Phase 1: No solar (Q1–Q3 2023)
Every watt came from the grid. Winter 2023 hit $782.92 for the quarter. That is about $8.50 a day just on electricity. For a household of five, that stung. Those first three quarters were the push I needed to get panels on the roof.
Phase 2: Solar only (Q4 2023 – Q4 2025)
The panels went on in October 2023 and you could see the difference straight away. Grid usage dropped from about 2,000 kWh per quarter to 1,100 to 1,400 in the warmer months. Bills roughly halved. But the seasonal swing was large. Summer quarters exported 2,200 to 2,500 kWh. Winter quarters only managed 1,500 to 1,850 kWh, and usage spiked because of heating. Q3 2025 was my worst solar-only winter at $594.92.
The fundamental problem never changed. I exported excess solar at 5 to 7 cents during the day and bought it back at 25 to 36 cents at night. You make cheap power you cannot keep. That is the whole case for a battery in one sentence.
Phase 3: Solar + battery (Q1 2026 onwards)
The battery went in February 2026. Look at what happened to grid usage: 2,248 kWh in Q2 2025 to 673 kWh in Q2 2026. That is a 70% drop. The bill went from $505.80 to $246.88. And Q2 2026 includes May and June, winter months.
Now look at the solar export column. In Q2 2026, exports dropped to just 306 kWh, down from 1,505 kWh the year before. Not because the panels generated less. Because the battery caught the excess instead of sending it to the grid at 7c. Every kWh the battery stored was a kWh I did not have to buy back later at 25c.
The same quarter, one year apart:
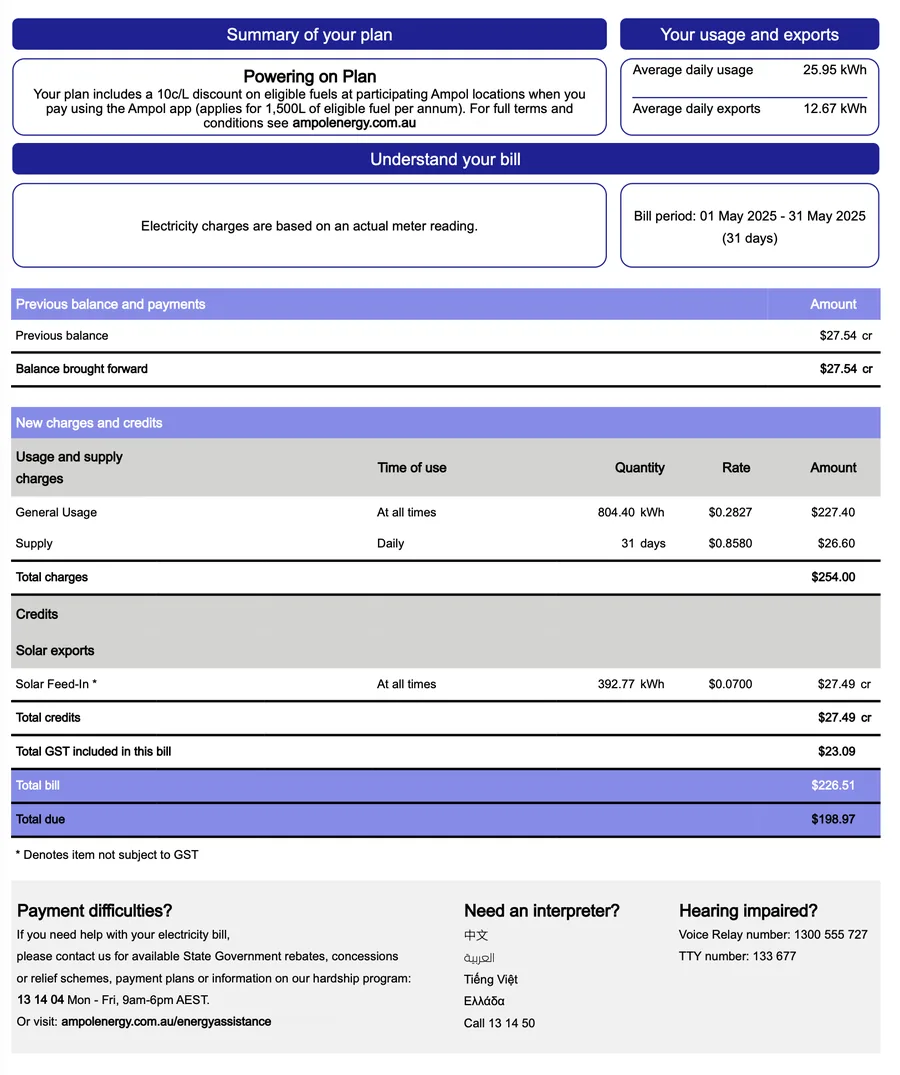
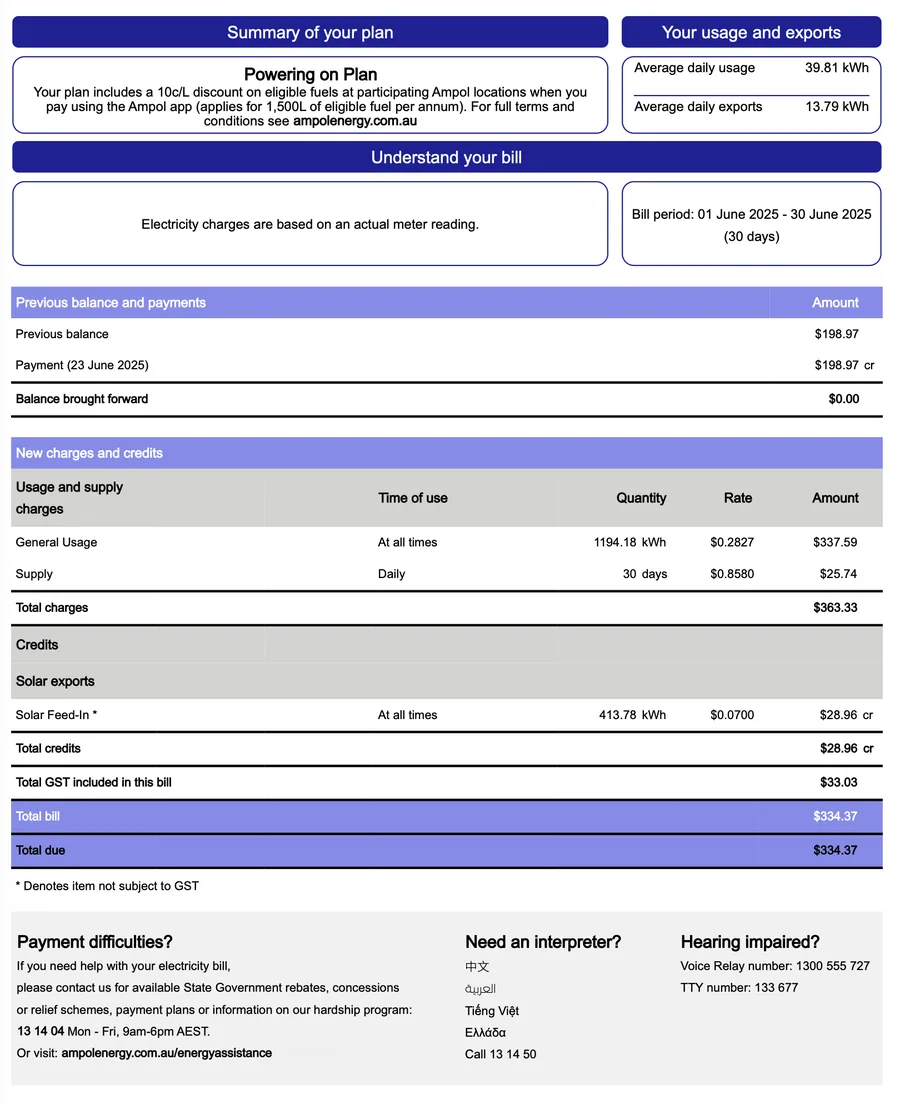
Q2 2025 (solar only) — April, May, June
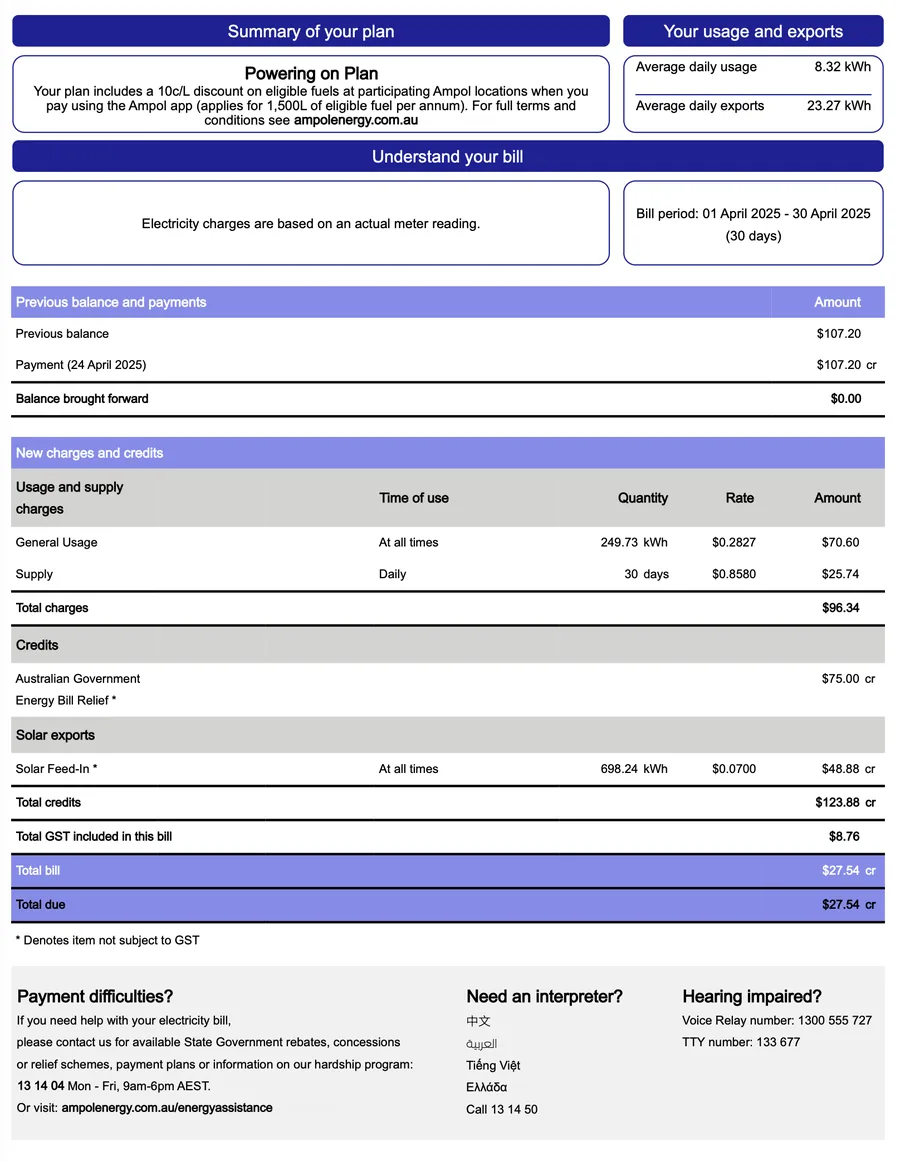
Q2 2026 (solar + battery) — April, May, June
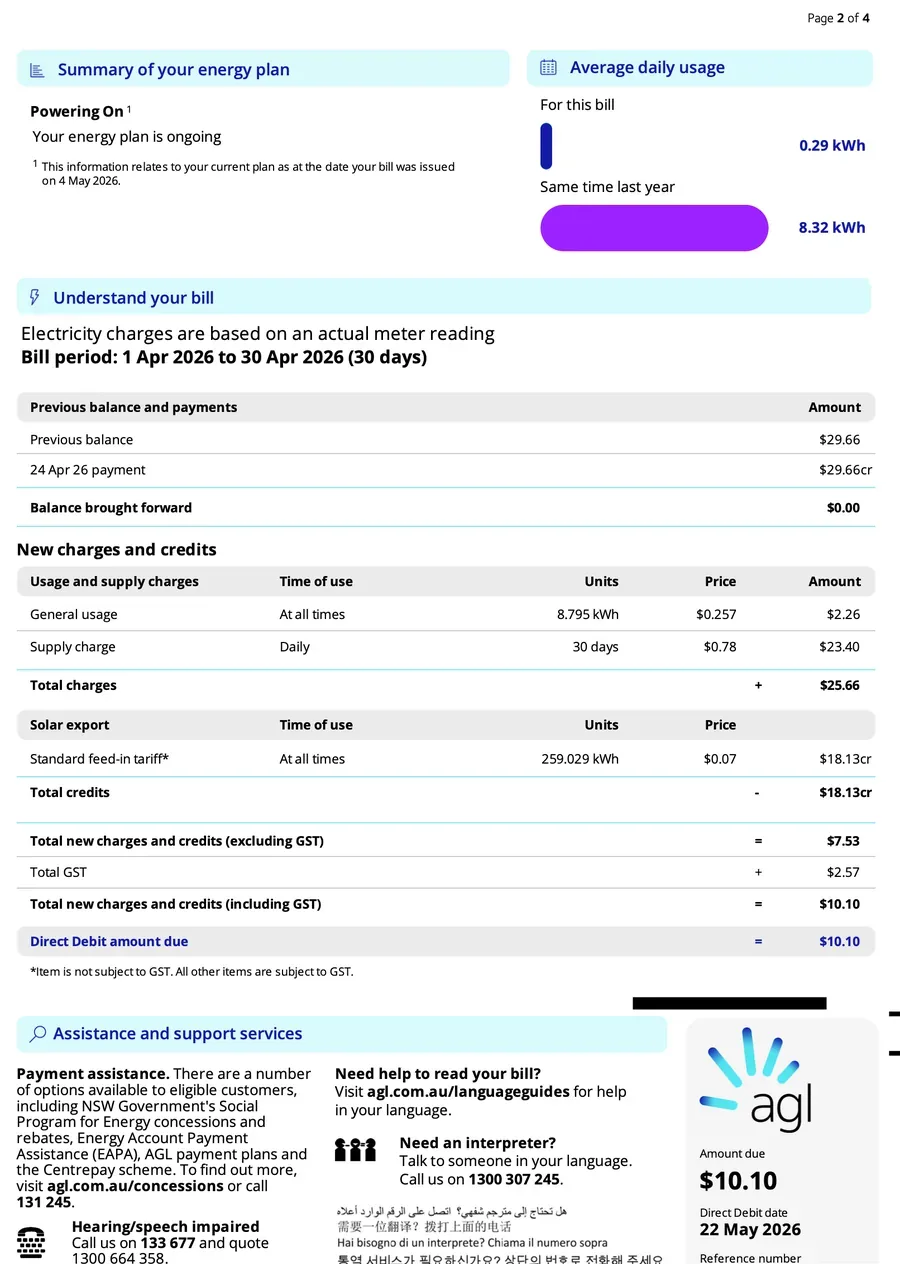
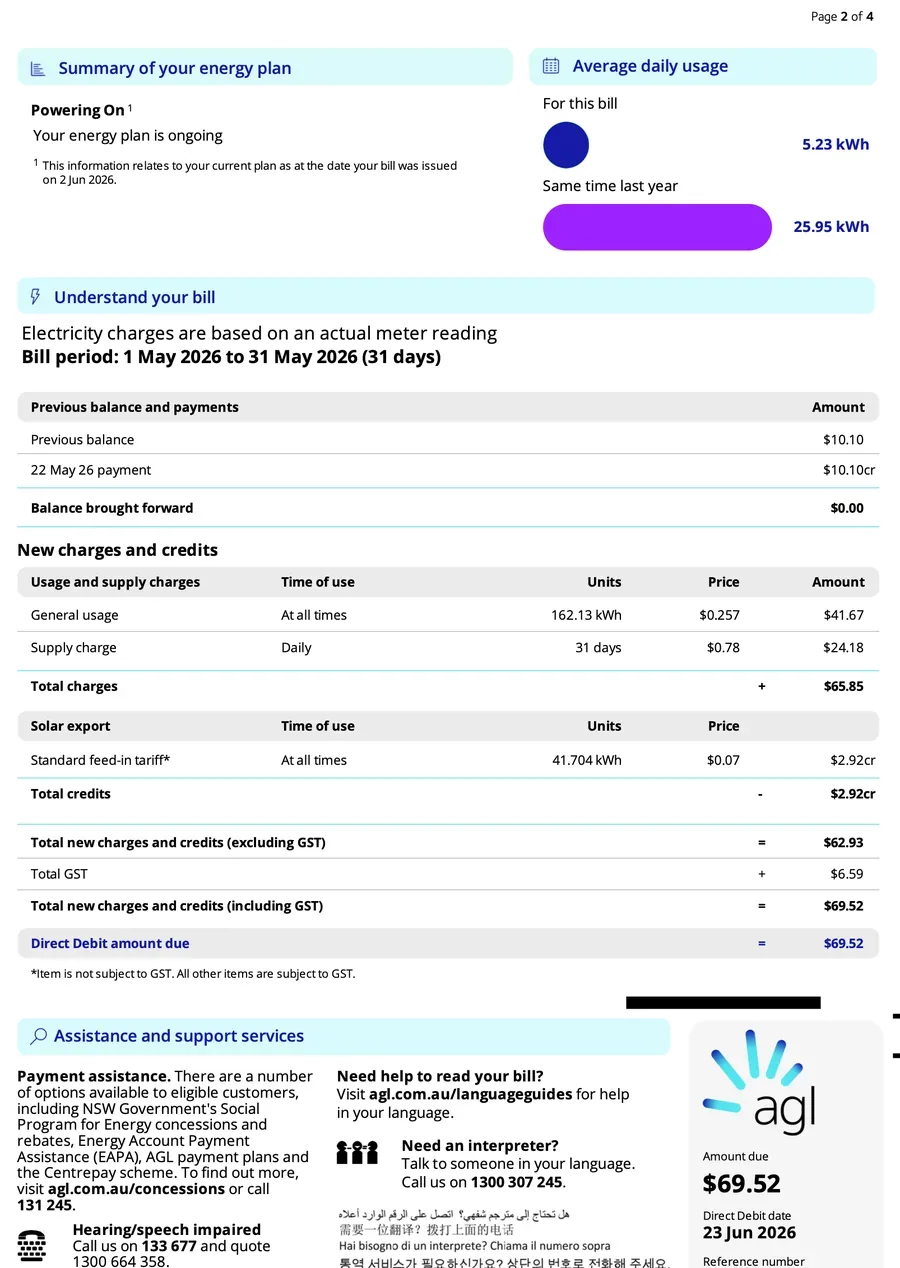
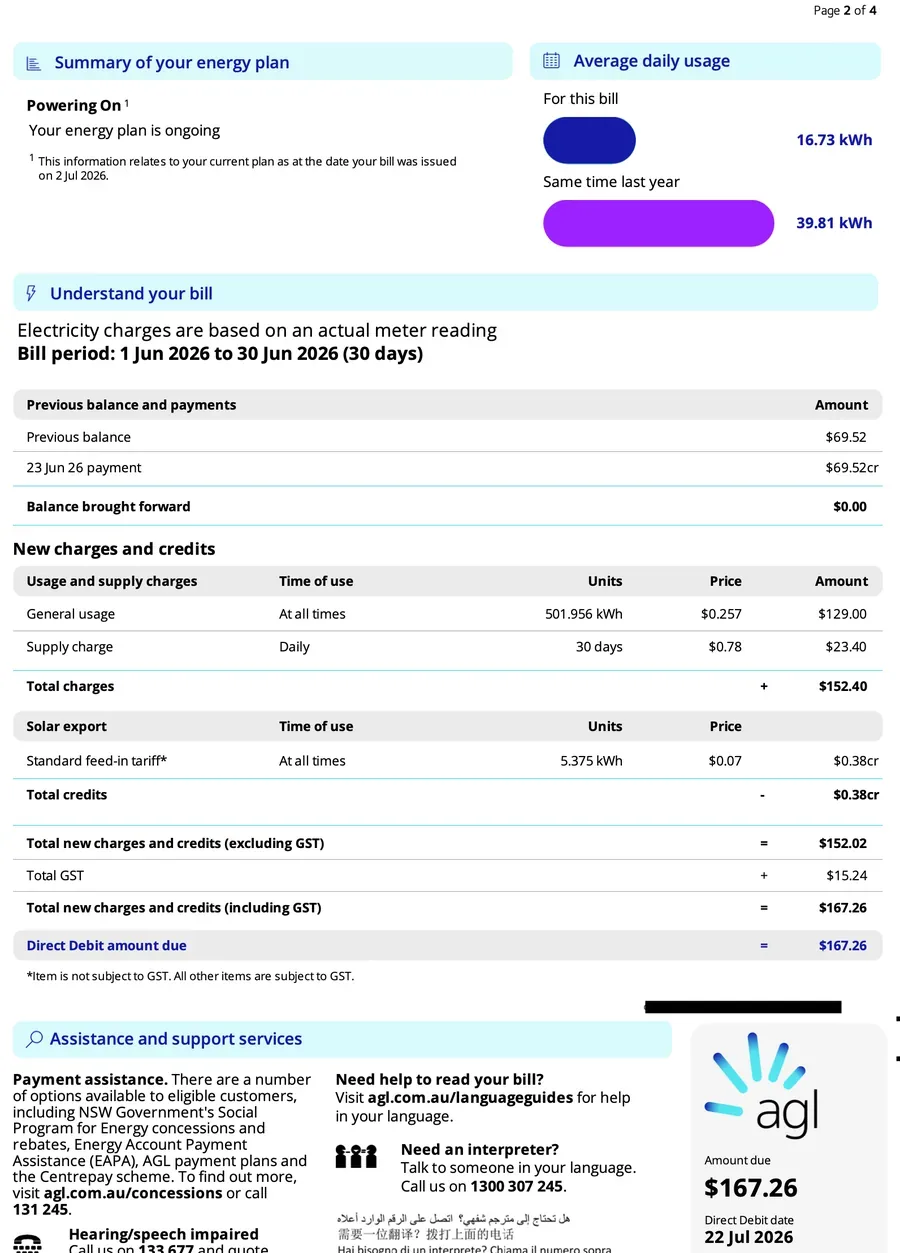
The best individual months show what is possible. April 2026 came in at $10.10, using 0.29 kWh/day from the grid. The rest of the bill was the daily supply charge minus a small export credit. That is about as close to grid-independent as you can get without disconnecting entirely.
A careful reader might notice April 2025 was a $27.54 credit while April 2026 cost $10.10. On the surface, the pre-battery month looks better. Here is why it is not. In April 2025 I exported 698 kWh to the grid at 7c, earning about $49 in feed-in credits. In April 2026 I exported just 259 kWh because the battery was capturing the excess instead. I earned less from exports but I also bought far less from the grid: 250 kWh in April 2025 versus 9 kWh in April 2026. The quarterly totals tell the real story: Q2 2025 cost $505.80 with 2,248 kWh of grid draw. Q2 2026 cost $246.88 with 673 kWh of grid draw. The battery does not make individual months look better on a bill. It shifts cheap exported power into avoided expensive imports. You see the result in the quarterly totals, not the monthly credits.
What I Actually Learned
- Solar alone is a solid start, but the export math is brutal. Generating power at 7c and buying it back at 25 to 36c means self-consumption is everything. Without a battery, your daytime schedule decides what you save.
- The battery does not create savings. It shifts them. It captures solar that would have been exported cheap and lets you use it when grid power is expensive. That spread, roughly 18c per kWh in my case, is what adds up.
- Winter is still winter. Short days plus electric heating means you will still pull from the grid. The question is how much. For me, the battery cut winter grid draw by more than half, but it did not eliminate it.
- The daily supply charge is a floor you can't break through. Even when I used 0.29 kWh/day from the grid, I still paid ~$23 in supply charges. A $10 bill is great, but $23 of it is unavoidable just for staying connected.
- Your retailer rate matters as much as your solar. I went from 36.7c/kWh peak with EnergyAustralia to 25.7c flat with AGL. That rate drop alone saved hundreds per year. If you have not checked your rates in a while, do it, panels or not.
The Bottom Line
Solar reduced my annualised electricity cost by about 43% against the pre-solar baseline. The first complete post-battery quarter implies a further reduction of about 44% against the solar-only annual average. That second figure is provisional; I need a full year of post-install bills before treating it as a durable result.
I am not saying everyone should get a battery. They are expensive, and the payback depends entirely on your usage pattern, your tariff, and what you pay for the hardware. My model suggests the numbers can work for this unusually large, heavily rebated setup, but the bills have not yet proved the battery's full-year return.
If you are researching solar or a battery, the tools on this site will use your household totals and rates. Upload a bill to prefill those fields, then confirm the daytime-use assumption used for your payback estimate.
See your own numbers
Upload your electricity bill to prefill usage totals and rates, then confirm the daytime-use assumption for your estimate.
Upload your billCommon Questions
Things people ask about my setup
How much did your bills drop after solar?
Bills roughly halved. Before solar I paid around $750 a quarter through winter. After panels went in, winter quarters dropped to the $500 to $600 range, and the sunny quarters came in around $350 to $400. Check Q2 2023 vs Q2 2024 in the table.
How much did the battery change things?
It made a large additional difference, but it has not yet produced more annual dollar savings than the panels. Q2 grid imports fell from 2,248 kWh in 2025 to 673 kWh in 2026, while the bill fell from $505.80 to $246.88. That is a 70% reduction in grid imports and a 51% lower bill for the matched quarter. Tariff, weather, and usage also changed, and I only have one complete post-install quarter, so the full-year battery effect is not proven yet.
Was the battery worth the cost?
It is too early to answer from bills alone. The model estimates about $970 in first-year battery savings and a 7.2-year payback at the rounded $7,000 installed cost. The limited observed data implies closer to $793 a year, but that is based on one complete post-install quarter and should not be treated as a full-year result. My unusually large battery and unusually low rebated price are not representative of a typical household purchase.
What solar system do you have?
7.92kW of panels with a 12kW hybrid inverter and a 53.76kWh battery. Panels went in around October 2023, the battery followed in February 2026. The system generates far more than we use during the day. That excess is why the battery made such a big difference. It captures power that would otherwise leave the house at 7c.
Related guides & tools
These are my personal electricity bills and numbers. Your results will differ based on your location, system size, tariff, usage patterns, and what you pay for your equipment. This is not financial advice. It is just one guy's data. Always get multiple quotes and do your own calculations before committing to solar or a battery.